Economics (McConnell) AP Edition, 19th EditionChapter 37:
International TradeWorked ProblemsProblem 37.1 - Gains from trade Problem: The production possibilities tables for Honduras and the Venezuela are shown in the tables below. Before specialization and trade, Honduras' optimal product mix is given by alternative C while optimal production in Venezuela is alternative J. | Honduras Production Possibilities | Product | A | B | C | D | E | Bananas | 20 | 15 | 10 | 5 | 0 | Mangos | 0 | 3 | 6 | 9 | 12 | | | | | | | | Venezuela Production Possibilities | Product | G | H | I | J | K | Bananas | 32 | 24 | 16 | 8 | 0 | Mangos | 0 | 10 | 20 | 30 | 40 |
- What is Honduras' opportunity-cost ratio for bananas and mangos?
- What is Venezuela's opportunity-cost ratio for bananas and mangos?
- Could these two countries gain through specialization? If so, in what products should they specialize?
- What is the total gain in production that could be achieved through specialization?
- What are the limits on the terms of trade between the two nations?
- Following specialization, suppose Honduras exports 10 units of bananas to Venezuela in exchange for 10 units of mangos. What are the gains from trade for each country?
| Answer: - In Honduras, 3 more units of mangos can be produced by giving up 5 units of bananas. The opportunity-cost ratio is 3M ? 5B, or .6M ? 1B.
- In Venezuela, 10 additional units of mangos can be produced by giving up 8 units of bananas. The opportunity-cost ratio is 10M ? 8B, or 1.25M ? 1B.
- Honduras has a lower opportunity cost of bananas while Venezuela has a lower opportunity cost of mangos. Honduras should specialize in bananas and Venezuela in mangos.
- Prior to specialization, the two countries' combined banana production was 18 (10 in Honduras and 8 in Venezuela). Total mango production was 36 (6 + 30). Following complete specialization, Venezuela will produce 40 units of mangos (a gain of 4 units) and Honduras 20 units of bananas (a gain of 2.)
- The terms of trade can vary anywhere between the pre-trade opportunity cost ratios. That is, anywhere between 1 unit of bananas for 0.6 units of mangos and 1 unit of bananas for 1.25 units of mangos.
- Following trade, Honduras would have 10 units of bananas (production of 20 minus exports of 10) and 10 units of mangos. Compared to its pre-trade choice at C, it has gained 4 units of mangos. Venezuela would obtain 10 units of bananas and retain 30 units of mangos (production of 40 minus its exports of 10.) This is a gain of 2 units of bananas compared to its pre-trade position.
|
Problem 37.2 - Equilibrium world price, exports, and imports Problem: Consider the domestic market for peaches in each of two countries, A and B, described in the tables below: Country A | Q S | Price | Q D | 8 | $3 | 14 | 10 | 4 | 13 | 12 | 5 | 12 | 14 | 6 | 11 | 16 | 7 | 10 | 18 | 8 | 9 |
Country B | Q S | Price | Q D | 16 | $3 | 28 | 17 | 4 | 26 | 18 | 5 | 24 | 19 | 6 | 22 | 20 | 7 | 20 | 21 | 8 | 18 |
Assume there are no trade barriers and no international transportation costs. - What are the (pre-trade) equilibrium prices of peaches in A and B?
- If the world price of peaches is $7, would country A export peaches or import them? In what amount?
- If the world price of peaches is $5, would country B export peaches or import them? In what amount?
- Assume these are the only two countries. Construct each country's export supply curve and import demand curve. What is the equilibrium world price of peaches? What quantity of peaches will be exchanged?
- At the price you found in part d, which country will export peaches and which will import them?
| Answer: - In A, domestic quantity supplied equals domestic quantity demanded = 12 at a price of $5. In B, domestic quantity supplied equals domestic quantity demanded = 20 at a price of $7.
- At a world price of $7, country A's domestic quantity supplied (16) exceeds its domestic quantity demanded (10) by 6 units. These 6 units would be exported onto the world market.
- At a world price of $5, country B's domestic quantity supplied (18) falls short of its domestic quantity demanded (24) by 6. These 6 units would be imported from the world market.
- Each country's exports (imports, if negative) is the difference between domestic quantity supplied and domestic quantity demanded at a particular world price. The graph is:
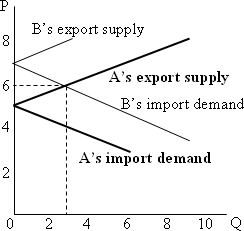 <a onClick="window.open('/olcweb/cgi/pluginpop.cgi?it=jpg::::/sites/dl/free/0217511447/883765/ch37_01.jpg','popWin', 'width=NaN,height=NaN,resizable,scrollbars');" href="#"><img valign="absmiddle" height="16" width="16" border="0" src="/olcweb/styles/shared/linkicons/image.gif"> (21.0K)</a> <a onClick="window.open('/olcweb/cgi/pluginpop.cgi?it=jpg::::/sites/dl/free/0217511447/883765/ch37_01.jpg','popWin', 'width=NaN,height=NaN,resizable,scrollbars');" href="#"><img valign="absmiddle" height="16" width="16" border="0" src="/olcweb/styles/shared/linkicons/image.gif"> (21.0K)</a>
The equilibrium world price is $6; the equilibrium quantity traded is 3. - A will export to B, as shown by the equilibrium along A's export supply and B's import demand curves.
|
 |  |